Plot Overview – Diagrams of the Various Social Predicaments
Some 50 years after his article “Hockey Helmets, Concealed Weapons, and Daylight Saving: A Study of Binary Choices with Externalities“, there are remains basic confusions about the varieties of social dilemmas or predicaments. There are 3 sorts of confusions: not distinguishing between a “Schelling” diagram and a “Dawes” diagram, not distinguishing between the basic shapes…
Some 50 years after his article “Hockey Helmets, Concealed Weapons, and Daylight Saving: A Study of Binary Choices with Externalities“, there are remains basic confusions about the varieties of social dilemmas or predicaments.
There are 3 sorts of confusions: not distinguishing between a “Schelling” diagram and a “Dawes” diagram, not distinguishing between the basic shapes of “Schelling” diagrams, and not distinguishing between pre and post choice calculations in an iterated choice sequence.
The effect of these confusions is that we are never able to get to an analysis about how coalitions or allies might form because of iterated play amongst strategically reasonable individuals. This is the picture we want to get to, in the end. An examination of reasonable coalition behavior. We are going to build up to this picture by going examining the 3 confusions.
1. Schelling v. Dawes Diagrams
Diagrams make a difference to what people see and take away. Diagrams by themselves need not be wrong to be unhelpful. I am going to argue when we want to investigation coalition building, finding of allies in a social dilemma when there is more than one play, we should use Schelling diagrams to investigate reasonable sequences of choices. The value of this enquiry is that we will finds dilemmas in which coalitions from because of reasonable strategic behavior.
We start with looking at the difference between the (2) diagrams.
Schelling Diagrams – Conditional Choice
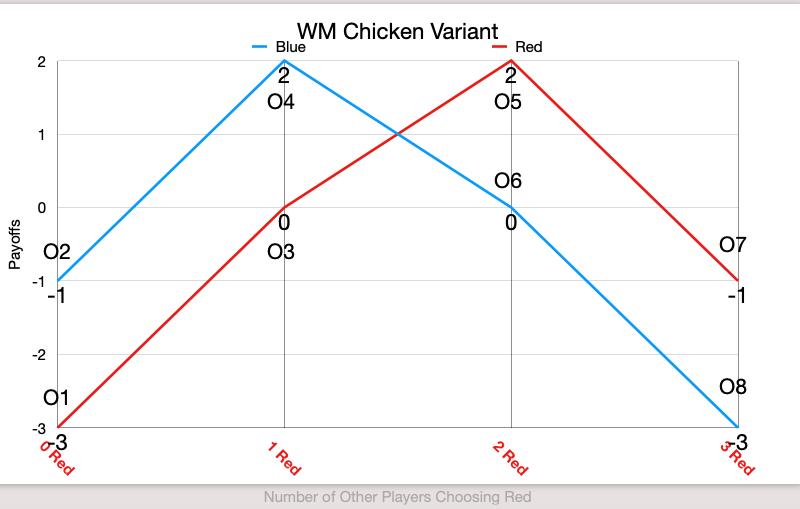
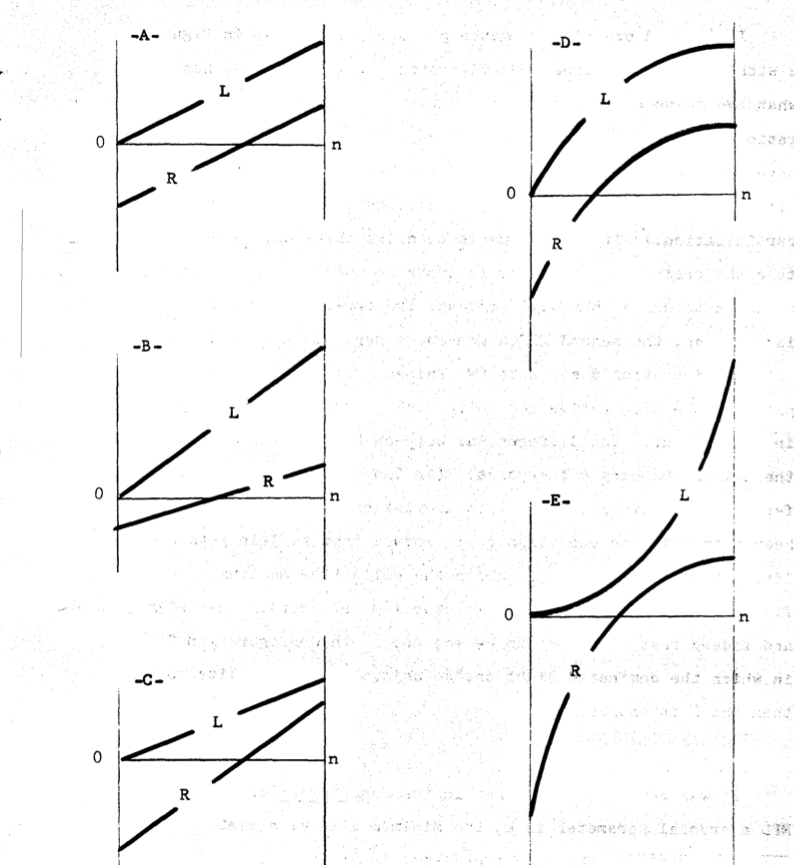
Here is an example of some of the different Schelling diagrams an n person dilemma could have. The x axis refers to the number of people will/have chosen to play R, which is the dominated choice. The diagrams reflect each person’s choice to play L or R, based upon their estimation or prediction of how many people will play R. In this case, the overall population is n+1.
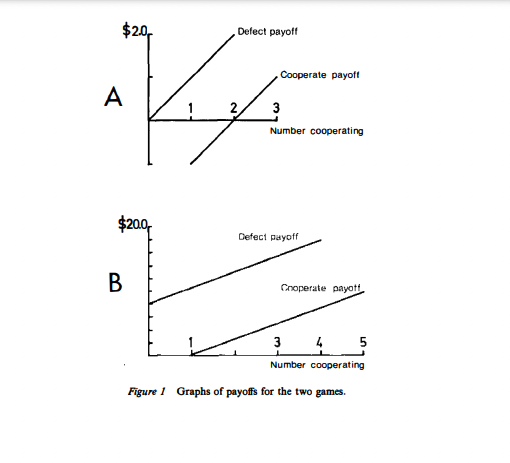
Dawes Diagram – Aggregate Collection
The intellectual father of Social Dilemmas, Robyn M. Dawes, immediately re-wrote these diagrams, removing the choice aspect. These “Dawes” diagrams show static pictures of aggregate decision making. The use of Dawes diagram is repeated in “Social Dilemmas”, S. Komorita and C. Parks, page 43, where ironically they are discussing Schelling’s coalition ideas.
For this to be a “Schelling” diagram, the payoff lines have have to begin and end on the same (2) points in the x axis.
Basic Shapes of Schelling Diagrams
There are 3 fundamental 2 person symmetric games which can be generalized to n person predicaments: the dilemma game, the chicken game and the stag hunt game.
Each one of these games has distinct characteristic view or diagram. This and more was explained with clear diagrams in Hockey Helmets, Concealed Weapons, and Daylight Saving: A Study of Binary Choices with Externalities.
For example, in 1990, Elinor Olson, in Governing the Commons, introduces her resolution to the 2 person dilemma game on page 15, but then on page 18 introduces a practical resolution of integrated multi-person taking turns or chicken game, the problem of assigning fishing rights in the inshore fishery at Alanya.
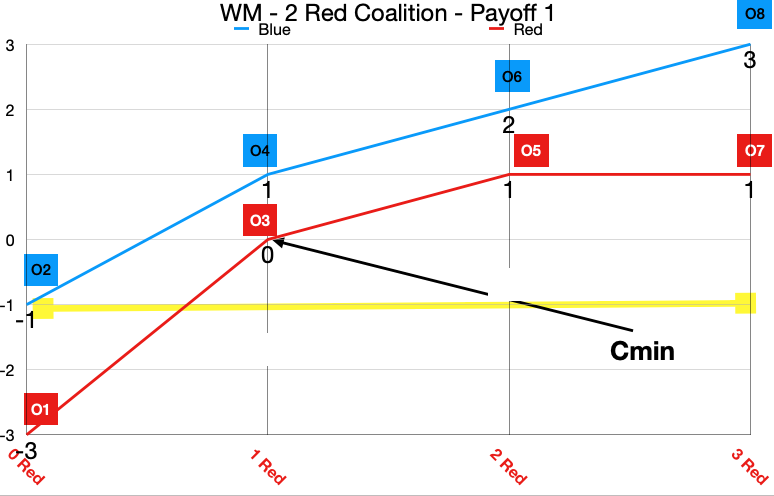
As, I will argue the canonical diagram for the chicken game looks like this.